Pivot Table
Introduction
Pivot Table convert the rows of the specified two fields into the fields of a new dataset based on values of the group fields.
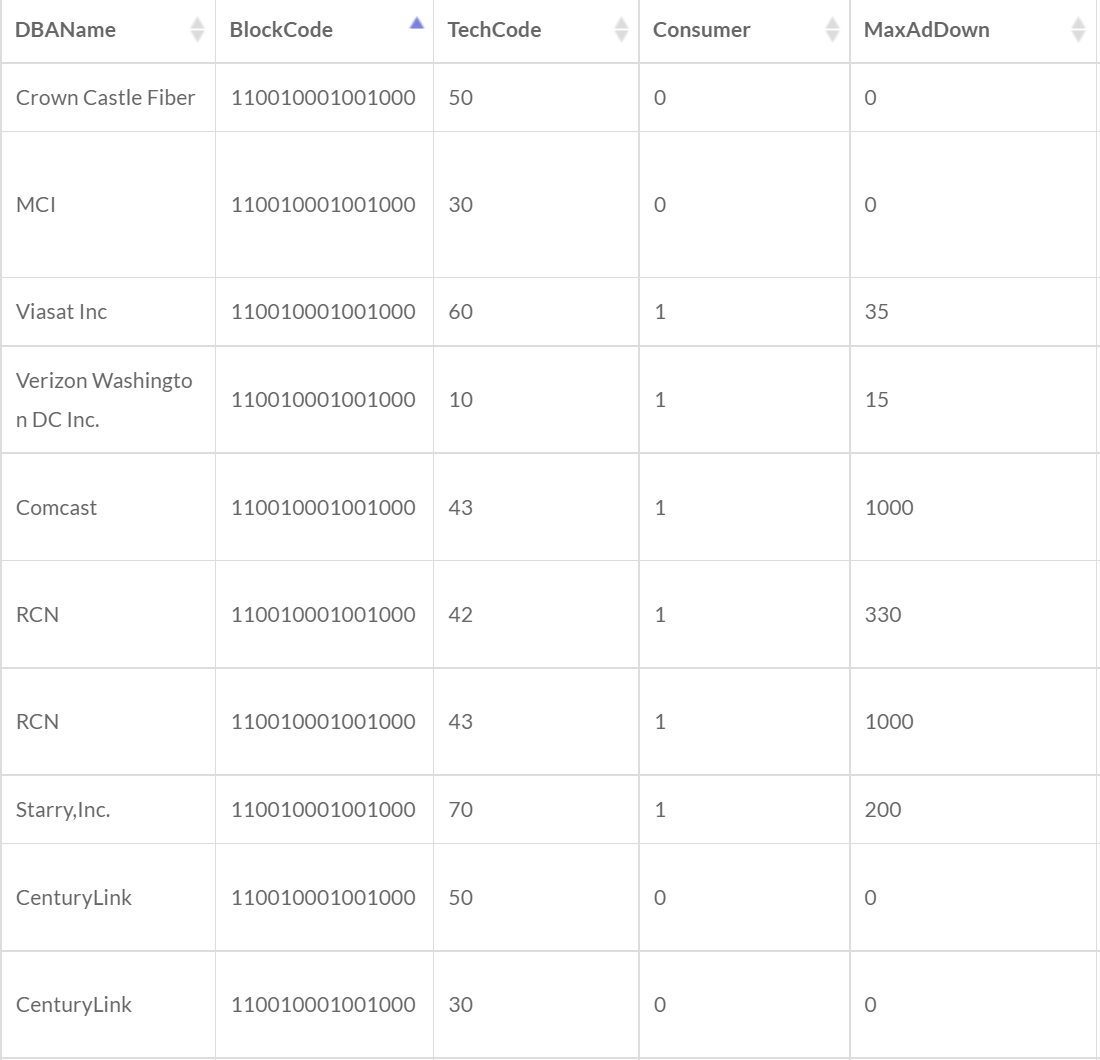
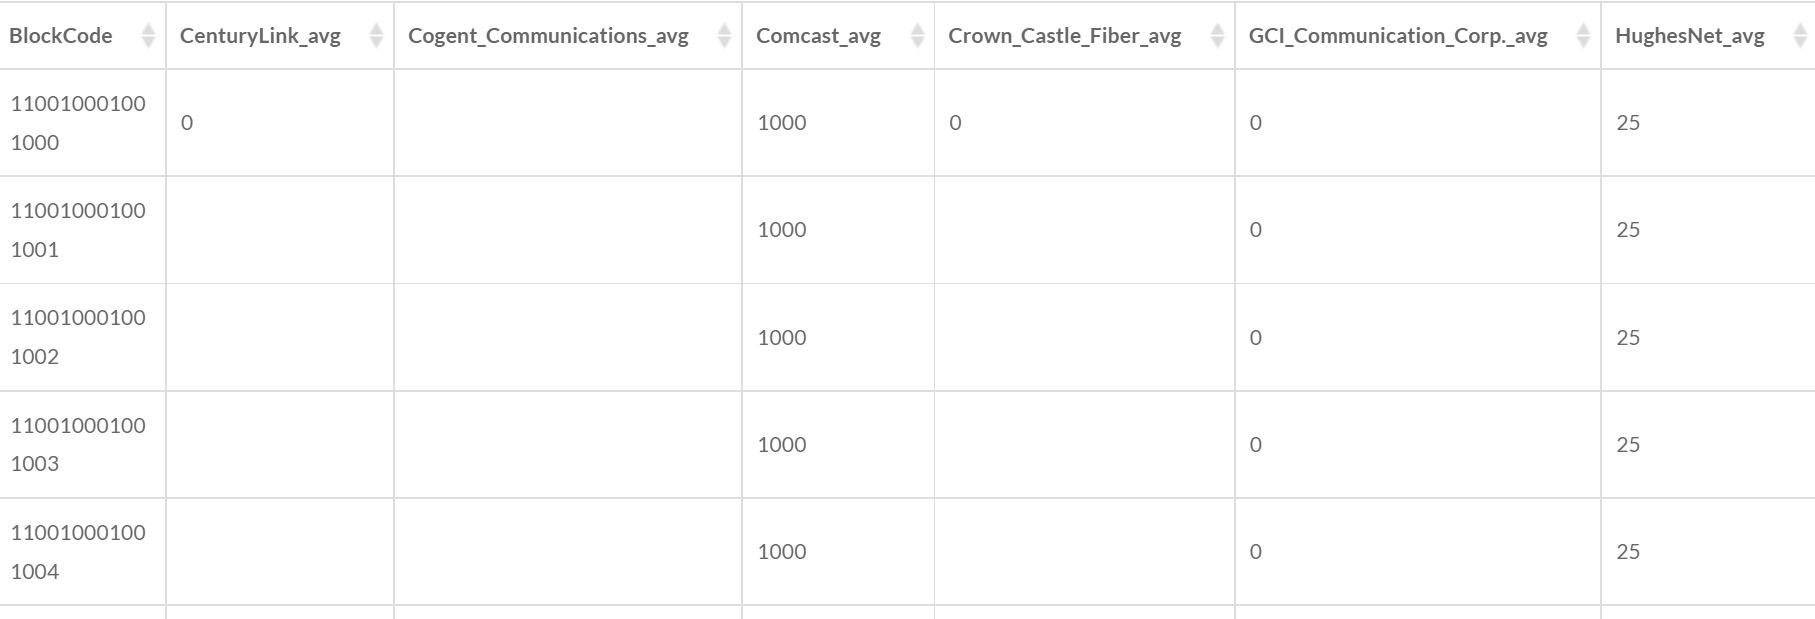
For example, the input data above are the broadband deployment data for blocks in an area. The provider DBAName can be selected as the Pivot Field, and the max advertised downstream speed MaxAdDown can be the Value Field. The block FIPS code BlockCode can be the Group Field, and the values in the same group can be aggregated by a method Average. The output data could be as follows:
1. Set the input data

- Input Data: Attribute data only.
2. Set the pivot fields
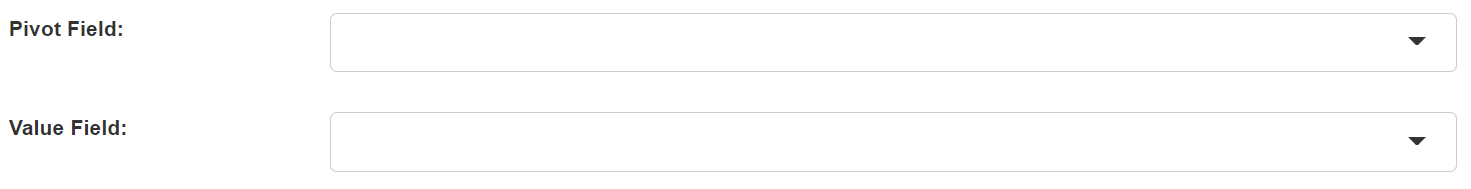
- Pivot Field: The values of the pivot field will be the field names in the new dataset.
- Value Field: The values of the value field will be the values of the pivoted fields in the new dataset.
3. Set the group fields

- Group Fields: The values of the group fields are used to divide the records into different groups. The records within the same group will be aggregated.
4. Set the aggregation method

- Aggregation Method: The method to merge the values of multiple records within a group.
- Sum: Calculate the sum of the values of the records within a group.
- Average: Calculate the average of the values of records within a group.
- Count: Calculate the number of the records within a group.
- Min: Use the minimum value of the records within a group.
- Max: Use the maximum value of the records within a group.
- Standard Deviation: Calculate the standard deviation of the values of the records within a group.
5. Set the output data

- Output Data Name: If no name is set, the default is "toolName_time".
6. Submit
After completing the above settings, click Submit to start the tool.
When it finishes successfully, a message will be shown at the top of the page. You can click the Open Data button to start accessing the data or go to the Data page to view it.